In this blog post we describe the concepts of monitoring and observability and explain how they can be applied to machine learning operations. We aim to give answers to questions such as "Why do I need observability?", "What are some of the unique issues for observability imposed by data and model pipelines, in addition to code pipelines?", and "How do I start addressing these challenges?".
Introduction to MLOps and monitoring
MLOps unifies Machine Learning (ML) development with system operations (Ops). Our effective MLOps approach combines the three pillars of technology, operating model, and culture to enable Continuous Integration (CI), Continuous Delivery (CD), Continuous Training (CT), and Continuous Monitoring (CM). MLOps is necessary to address the "Hidden Technical Debt in Machine Learning" [1] which can threaten to overwhelm practitioners.
Monitoring is an important aspect for the deployment and operation of modern applications. For example, Google placed emphasis on monitoring the "Four Golden Signals" (latency, traffic, errors, saturation) for distributed systems [2]. Service Level Objectives (SLOs), i.e., precise numerical targets for system reliability, require that Service Level Indicators (SLIs), such as error rate or response times, are monitored and aggregated over time. (See also this blog post from our partners.) Failures are inevitable, and in modern DevOps and SRE workflows, they are indeed embraced as normal and managed through concepts such as blameless post-mortems and error budgets which help manage tradeoffs between innovation and reliability [3]. Monitoring is a key capability of application performance management (APM) solutions.
Monitoring is not enough
While systems won't always work perfectly, your customer should not be the first to inform you about a failure of your system. That is why observability is important. It goes beyond the concept of monitoring and includes the combination of data collection, visualization, correlations, and smart alerting to reduce both the mean-time-to-detection (MTTD) and the mean-time-to-resolution (MTTR) of incidents. Observability means that internal states of systems can always be determined from the outside. It is the capability to ask arbitrary questions (which are still unknown) about the system. (See also this blog post from our colleagues.)
A metric such as "machine A currently has a memory utilization of 90%" --- which can be detected using classical monitoring solutions --- is hardly useful if we do not know whether this kind of usage is normal or abnormal for that particular machine. We need to view the utilization in a historic context, and in the context of other machines of the same type. We must also understand which processes are currently executed and if they changed recently. Only then can we assess if the utilization presents a potential problem or is typical of normal functioning.
In this blog post, we will first introduce concepts of observability in more detail, as they are commonly used by DevOps engineers. Then we’ll go a step further and discuss some of the unique challenges that observability for MLOps faces, why they are difficult to address with classical observability solutions, and how to start solving them.
Observability as part of DevOps
Observability goes beyond monitoring by combining metrics, events, logs, and traces to help detect, investigate, and resolve unknown unknowns. This means we want to be able to debug the unexpected. If we wait until an incident occurs to collect debugging data, we will need to wait until it occurs again, severely increasing MTTR. Instead, we want to continually collect all relevant information (i.e., not just aggregates of the data) before we even know what we are looking for.
The goal is to always understand the current state of the system, and how that state was reached. The term "system" here includes all our application and infrastructure components across the different layers (see also here).
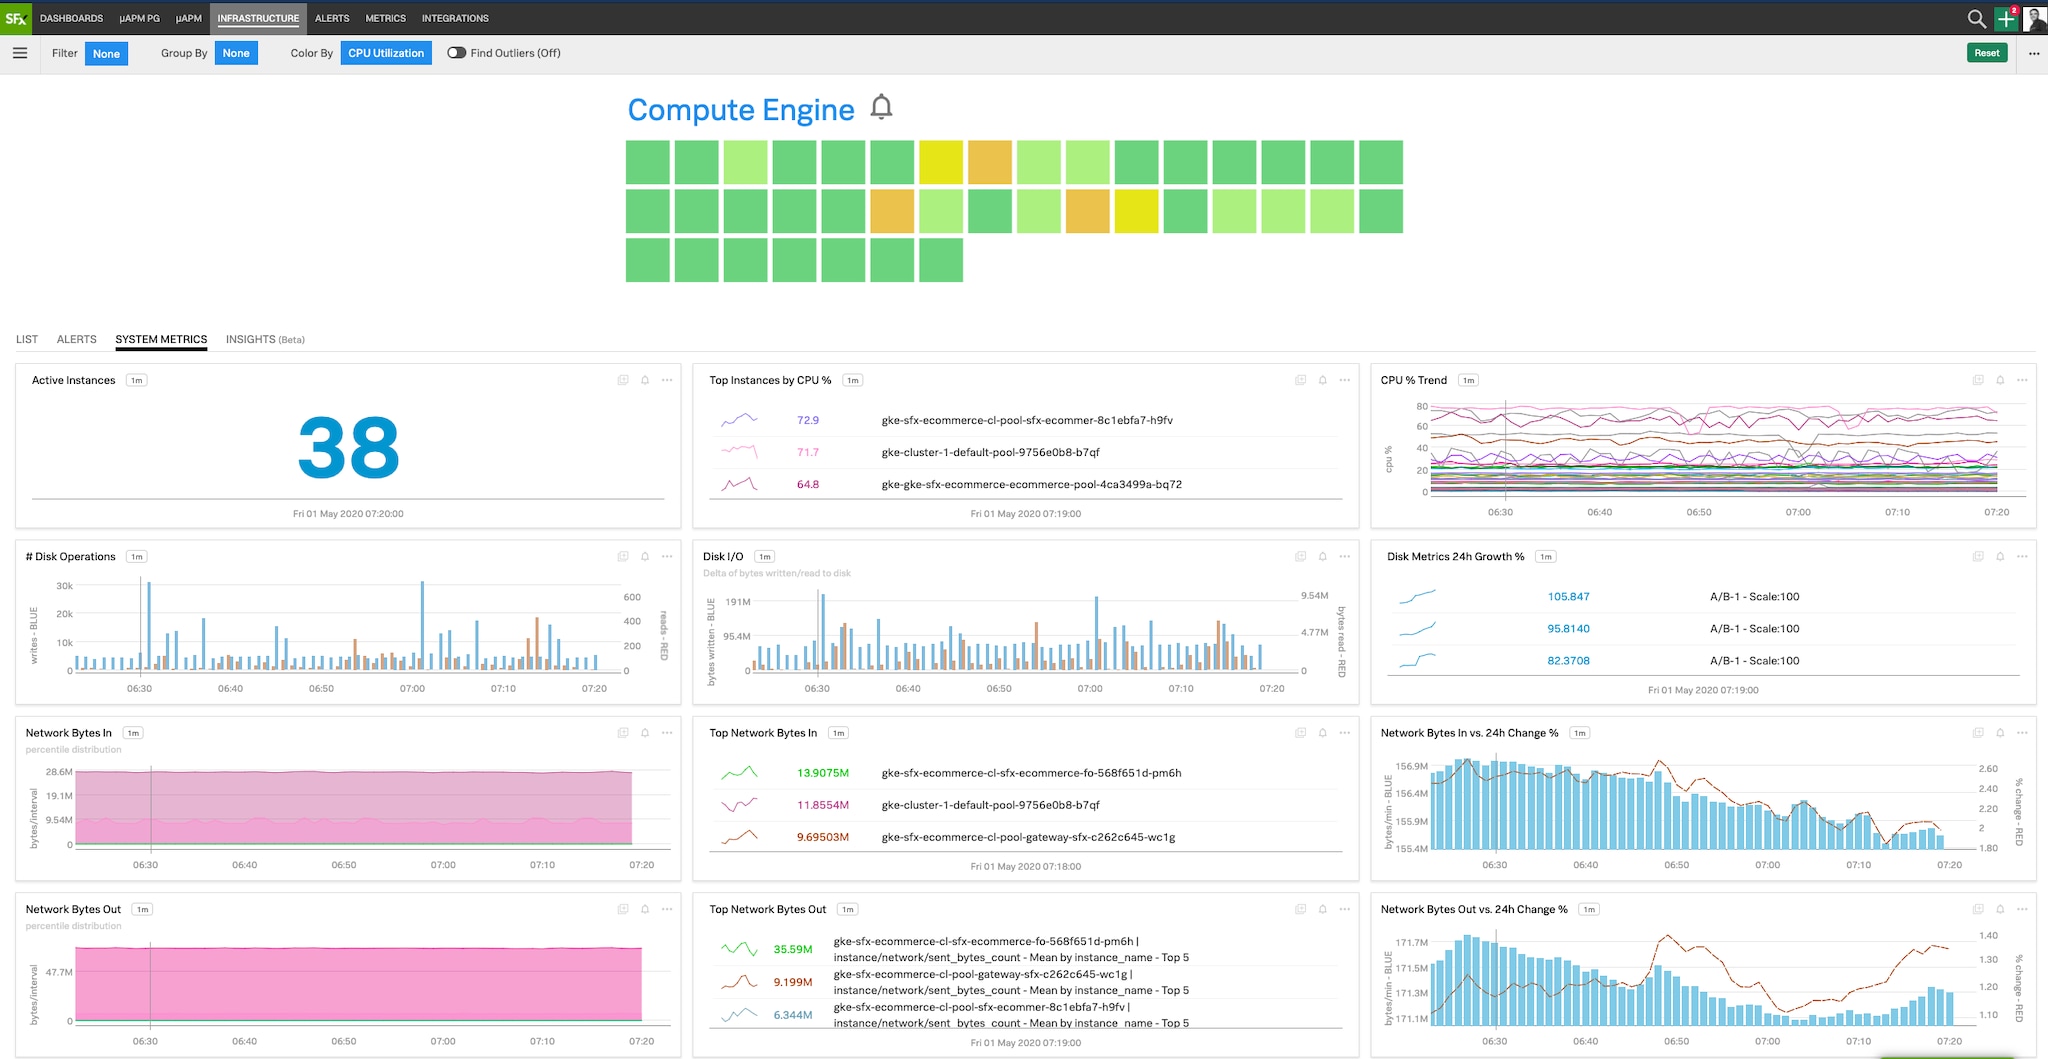
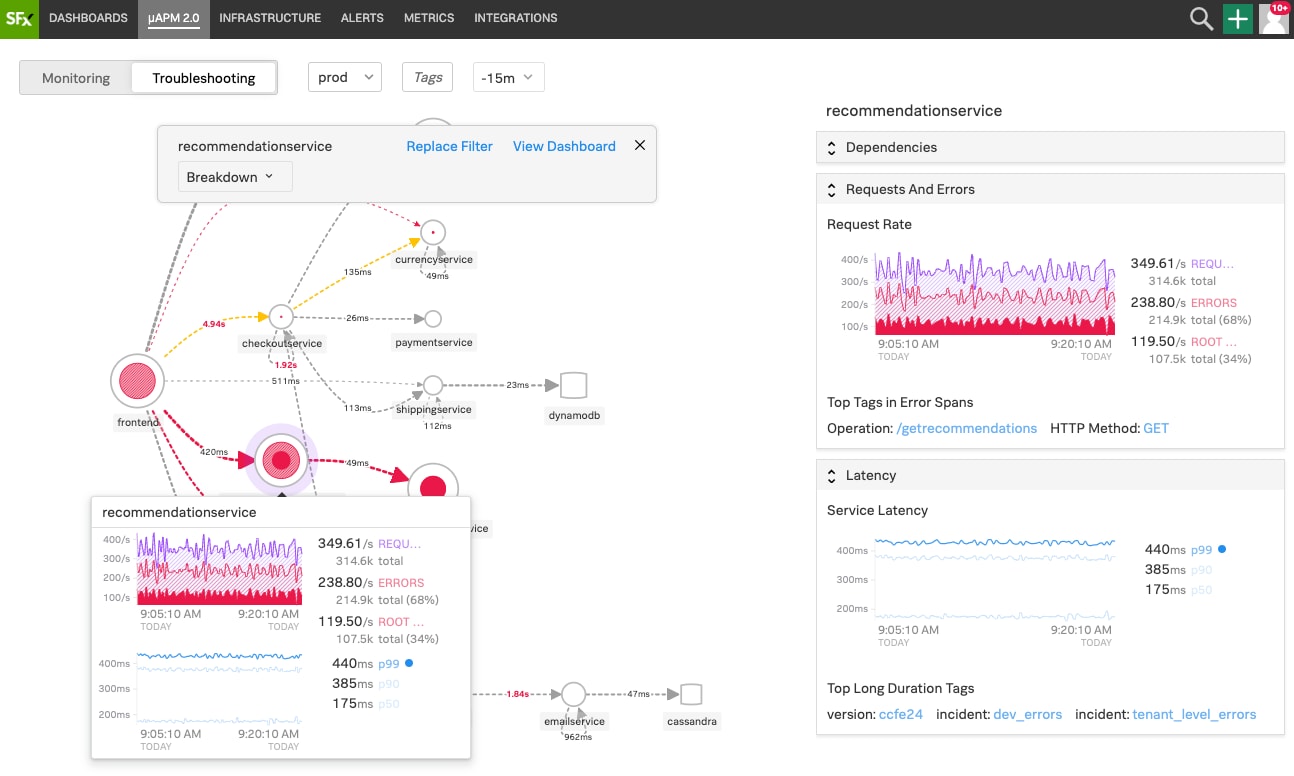
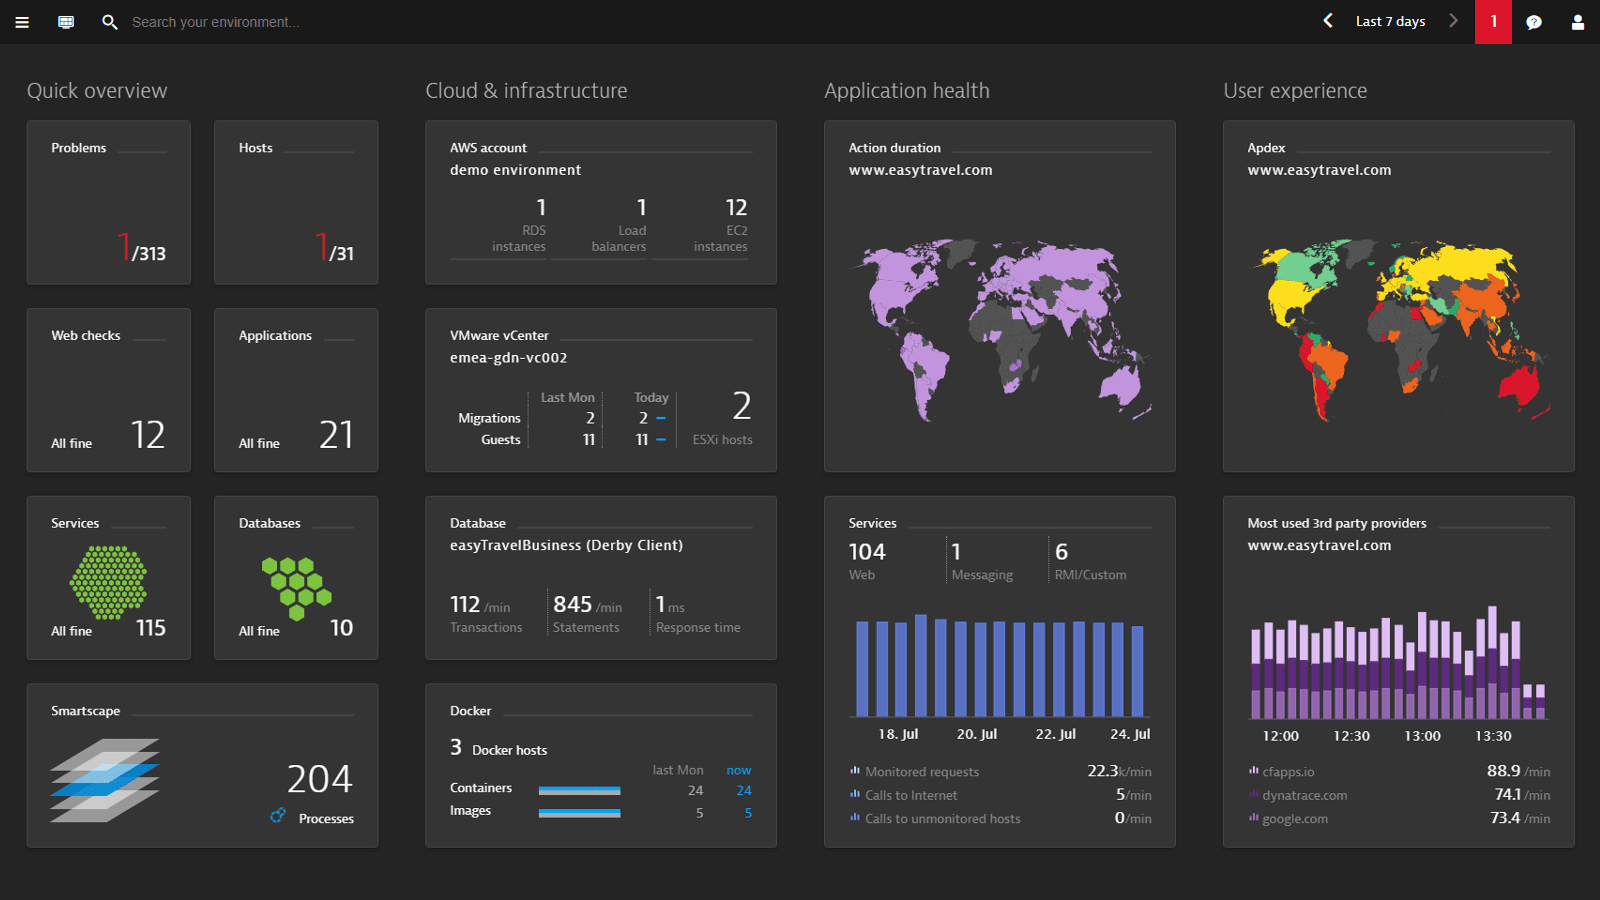
Observability can be seen as a combination of different monitoring solutions that generates more value than the summed value of all individual components. Application Performance Monitoring (APM) gives us insight into how our applications are performing, while Infrastructure Monitoring (IM) allows us to inspect how our infrastructure (which might follow a microservices architecture) is functioning. Monitoring user experience is a central part of observability. In contrast to Synthetic Monitoring, which helps detect general user-facing issues such as slow API endpoints, Real User Monitoring (RUM) gives visibility into the complete end-to-end journey of actual customers, from the web browser to our application. Automated alerts can be triggered and forwarded to the relevant employee; for example, if memory utilization gets close to 100%, or an increasing number of requests receive slow responses from our system. Graphical dashboards display, in near real-time, collected metrics, events, logs and traces, as well as any alerts that were fired (see Figure 3 for some examples).
An advanced observability solution will allow us not only to receive an alert about a customer encountering an issue, e.g., when they try to put an item into their shopping cart but also to combine different monitoring solutions for the provision of deeper insights. It will allow us to view the trace of the whole user journey in the context of relevant application and infrastructure performance, by correlating metrics, events, traces, and logs.
Observability for MLOps is not AIOps
Many observability solutions now advertise "intelligent" observability; that is, machine learning tools are employed to support DevOps and ML operations including observability, which is also known as "AIOps". This can be extremely valuable as it can help with detecting anomalies or discovering and correlating related data. However, it is worth clarifying that this is not the topic of this blog post. Here, we are not focusing on "intelligent monitoring of systems" (AIOps) but rather the "monitoring of intelligent systems" during development and production, meaning the observability of the whole machine learning lifecycle from data collection to model deployment. (Of course, AIOps can also be used to improve the observability in MLOps which would then result in "intelligent monitoring of intelligent systems".)
Observability as part of MLOps
Traditional DevOps observability
Many of the traditional DevOps observability solutions will also be invaluable for observability in MLOps. We want to know if our model server is running, how much RAM and CPU it is consuming, and how fast predictions are being computed. We also want to answer how long a customer must wait for a prediction, which service affects the latency the most, and many other questions commonly encountered in distributed systems.
The need for specialized MLOps observability
Let’s assume a company builds and operates a successful web application using DevOps/SRE practices and is now hoping to leverage artificial intelligence to improve some part of their platform. The company will quickly realize that it is not as simple as having their data scientists build a model, deploy that model into production, and never touch it again. Models are never “finished”, and to extract maximal value for the business, they need continuous development.
On the one hand, they might discover that customers start complaining about the quality of the model’s predictions. This can be addressed by building separate data and model pipelines that allow for continuous integration and deployment of machine learning systems (see, e.g., this blog post for how this is done within our effective MLOps approach).
On the other hand, the company might discover that even though some customers report being unhappy, none of their traditional observability tools seem to show any incidents or anything out of order. The model-serving instances are running without any problems, and input data is being processed without errors. This is where observability for MLOps comes in, which addresses several challenges not commonly encountered in non-ML systems.
IBM Watson made treatment recommendations for cancer patients at a hospital. It later turned out that many of these recommendations were potentially unsafe [6]. Observability tools are critical for detecting issues early and preventing malfunctioning models from making it to production.
Unique challenges of monitoring ML models
Challenges related to the data
Data in the real world is often messy; for example, due to missing values, which is why models are commonly trained using cleaned data. This can pose a challenge when the model is used in production. Although robust pipelines will be able to deal with missing values to some extent (e.g., by interpolating them based on training data distributions), a much higher frequency of missing values in the real world can mean that the model’s performance degrades.
A change in the data schema can happen due to changes in how the data is represented or collected. For example, a front-end engineer might change one of the data input fields from "required" to "optional," and customers stop filling in the field, leading to an increase in "missing values," which get substituted using default values.
A company might decide to change the height representation from "inches" to "centimeters" but not re-train the model or update the data transformation stage within their data pipeline. The meaning of an input value of "100" drastically changed, but the model will likely continue to make predictions without errors. However, model predictions will probably be wrong and, for example, lead to all customers being classified as "morbidly obese" (see also this rather amusing news story).
Many of these issues are related to the concept of "data drift," which roughly means that the distribution of the test set (which is being produced on the live system) diverges from the distribution of the training set. Small and valid changes in our data can lead to models failing spectacularly in terms of their prediction performance. However, they might not trigger any of the traditional DevOps alarms as all systems are still operating without errors. This means we want to keep track of the distributions of the input data --- both for each individual feature as well as their joint distributions to detect any change.
Challenges related to the model
Changes in the (real-world) environment in which a model is deployed can also lead to interesting situations where a model’s prediction for some input was considered "correct" a year ago, but is now regarded as "incorrect." For example, because human language evolves, new words are invented, and the word’s meaning can change, a sentiment classifier trained on historical data might not work well on contemporary speech. We need to be able to monitor the model’s performance and update the model when necessary.
Sometimes model performance can be evaluated immediately by obtaining ground truth; for example, we can check if a user accepted one of the top recommendations for a recommendation system. Other times ground truth might only be available after some time or even be impossible to obtain; for example, if a model prediction leads to a pharmaceutical intervention for a patient, we cannot know if an alternative intervention would have led to a different outcome. Nevertheless, we always want to keep track of input data, model output, and (as far as possible) model performance.
Even though a model might work well when only considering accuracy, we won't be happy with it if it is biased against some group of customers. If it turns out that although our model works well in general with >90% accuracy but always gives the wrong prediction for "pregnant women," the model will be unacceptable. Fairness in artificial intelligence is an active research topic, and avoiding all bias is laborious [10, 11]. Nevertheless, essential steps toward detecting and avoiding bias are collecting representative data and monitoring the relationship between input features and model output. This is also important even if it seems like the currently deployed model is unbiased, as the notion of fairness, and its interpretation, might change over time.
How to start tackling these challenges
Observability can help reduce MTTD and MTTR of many of these issues. It allows us to perform root cause analysis so that when a model fails, we can detect if the issue stems from the original data, the feature transformation, or something else.
An MLOps observability solution should collect data (metrics, events, logs, and traces) from all steps within the ML lifecycle and deliver actionable insights to the right people. It should monitor data distributions throughout all stages in a variety of forms. Distributions of individual features, joint distributions of features, and conditional distributions (e.g., split by target variable) can all provide different insights into data quality. The solution should also be able to detect missing values and schema changes. Visualizations should be specific to the situation, interactive, and easily adaptable; for example, by showing feature distributions conditioned on a target variable chosen by the user, before and after the data transformation step — and how they changed over time.
We can define (and iterate on) input data schemas; for example, human adults should be between 30 and 300 centimeters tall and alert relevant people if those schemas are violated. Similarly, we can monitor the output data and alert on things such as a predicted probability not being between 0 and 1 or a model starting to predict one possible value much more often than alternative values.
Model explainability can be leveraged to gain insight into why a model made a certain prediction. For example, LIME or SHAP values can be used to analyze the relationship between input features and model predictions. This can help us understand if a model is underperforming or biased against a particular sub-group.
One area in which explainability can be especially relevant is healthcare (see also our blog posts about ML for healthcare: here and here). It is vital that doctors and patients do not simply have to trust an algorithm blindly but that they can inspect the model’s estimation and understand how and why the model arrived at a particular outcome. With the integration of AI into many critical business areas, including IT systems, explainability will become ever more critical for accepting machine learning models. Stakeholders will want to "trust but verify" that their intelligent systems work as expected.
Lastly, it is worth emphasizing that observability is a collaborative effort and should include collaboration and communication loops between stakeholders, developers, operations, and end-users. This will ensure that customer experience does not degrade --- and indeed improves --- over time.
Machine Learning Architects Basel
Machine Learning Architects Basel (MLAB) is part of the Swiss Digital Network (SDN). We have developed an "effective MLOps" approach based on our expertise about machine learning, MLOps, as well as extensive knowledge and experience around DevOps, SRE, and observability of classical non-ML systems. This is also based on our tried and tested "effective SRE" approach. Effective MLOps includes observability for data and models as one of its pillars.
We are individuals with background in machine learning and experience in in building advanced machine learning solutions, deploying them into production, and setting up observability solutions. Notably, a successful digital transformation to implement observability usually requires a change in company culture in which developers and operations teams work together towards the same goal. MLAB provides extensive training opportunities to ensure any digital transformations we are involved in are successful.
We are agnostic towards specific implementations and tools of observability. The current landscape of observability includes commercial, enterprise, and DIY / open-source solutions, and we will always help our customers pick the best tool for their specific situations.
If you are interested in learning more about how MLAB can help your business generate sustainable value by building and running reliable machine learning solutions, including observability, please do not hesitate to get in touch.
References and Acknowledgements
- https://proceedings.neurips.cc/paper/2015/file/86df7dcfd896fcaf2674f757a2463eba-Paper.pdf
- https://sre.google/sre-book/monitoring-distributed-systems/#xref_monitoring_golden-signals
- https://sre.google/sre-book/postmortem-culture/
- https://www.gartner.com/doc/reprints?id=1-28F5GMDU&ct=211213
- https://www.splunk.com/content/dam/splunk-blogs/images/2020/05/gcp_overview.png, https://www.splunk.com/content/dam/splunk-blogs/images/2020/05/Minimize_MTTR.png, https://www.curix.ai/wp-content/uploads/2021/08/dashboard-overview-curix.png, https://dt-cdn.net/images/homescreen-1600-8ebc269084.png
- https://www.theverge.com/2018/7/26/17619382/ibms-watson-cancer-ai-healthcare-science
- https://www.cbsnews.com/news/ibm-watson-supercomputer-turns-to-medicine/
- https://www.bbc.com/news/uk-england-merseyside-56111209
- https://snapengage.com/what-are-chatbots/
- T. Bolukbasi, K.-W. Chang, J. Y. Zou, V. Saligrama, and A. T. Kalai, “Man is to computer programmer as woman is to homemaker? debiasing word embeddings,” in Advances in Neural Information Processing Systems 29, D. D. Lee, M. Sugiyama, U. V. Luxburg, I. Guyon, and R. Garnett, Eds., 2016.
- Verma, S., & Rubin, J. (2018, May). Fairness definitions explained. In 2018 IEEE/ACM international workshop on software fairness (fairware) (pp. 1-7). IEEE.
- https://evidentlyai.com/blog/machine-learning-monitoring-data-and-concept-drift
- https://github.com/deepchecks/deepchecks/blob/main/docs/images/train-test-drift-output.png
- https://www.forbes.com/sites/korihale/2021/09/02/ai-bias-caused-80-of-black-mortgage-applicants-to-be-denied/